Matplotlib:subplots绘制多子图
调整子图间距和整体空白
fig.tight_layout()#调整整体空白
plt.subplots_adjust(wspace =0, hspace =0)#调整子图间距
创建一个图像对象(figure) 和 一系列的子图(subplots)。
def subplots(nrows=1, ncols=1,
             sharex=False, sharey=False, squeeze=True,
             subplot_kw=None, gridspec_kw=None, **fig_kw):


# 返回值
return fig, axs
参数
nrows,ncols:子图的行列数。sharex,sharey:- 设置为
True或者all时,所有子图共享 x 轴或者 y 轴, - 设置为
Falseornone时,所有子图的 x,y 轴均为独立, - 设置为
row时,每一行的子图会共享 x 或者 y 轴, - 设置为
col时,每一列的子图会共享 x 或者 y 轴。
- 设置为
squeeze:- 默认为 True,是设置返回的子图对象的数组格式。
- 当为 False 时,不论返回的子图是只有一个还是只有一行,都会用二维数组格式返回他的对象。
- 当为 True 时,如果设置的子图是(nrows=ncols=1),即子图只有一个,则返回的子图对象是一个标量的形式,如果子图有(N×1)或者(1×N)个,则返回的子图对象是一个一维数组的格式,如果是(N×M)则是返回二位格式。
subplot_kw:- 字典格式,传递给
add_subplot(),用于创建子图。
- 字典格式,传递给
gridspec_kw:字典格式,传递给GridSpec的构造函数,用于创建子图所摆放的网格。- class matplotlib.gridspec.GridSpec(nrows, ncols, figure=None, left=None, bottom=None, right=None, top=None, wspace=None, hspace=None, width_ratios=None, height_ratios=None)
- 所有其他关键字参数都传递给 figure()调用。如,设置 figsize=(21, 12) ,则设置了图像大小。
返回值
fig:matplotlib.figure.Figure对象ax:子图对象(matplotlib.axes.Axes)或者是他的数组fig, axes = plt.subplots(23):即表示一次性在figure上创建成2*3的网格
规则划分
import matplotlib.pyplot as plt
import numpy as np

x = np.linspace(0, 2 * np.pi, 400)
y = np.sin(x ** 2)

# 创建一个子图
fig, ax = plt.subplots()
ax.plot(x, y)
ax.set_title('Simple plot')

plt.show()

创建两个子图,并且共享y轴
f, (ax1, ax2) = plt.subplots(1, 2, sharey=True)
ax1.plot(x, y)
ax1.set_title('Sharing Y axis')
ax2.scatter(x, y)

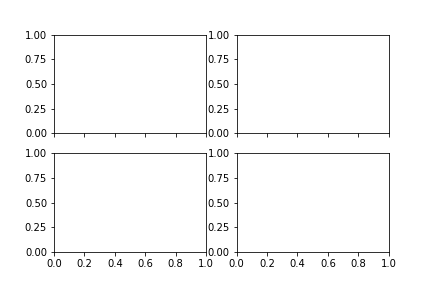
创建4个子图
fig, axes = plt.subplots(2, 2, subplot_kw=dict(polar=True))# polar:极地
axes[0, 0].plot(x, y)
axes[1, 1].scatter(x, y)

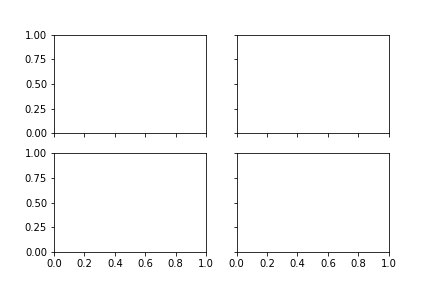
共享每列子图的x轴
plt.subplots(2, 2, sharex='col')
共享每行子图的y轴
plt.subplots(2, 2, sharey='row')

共享所有子图的 x 和 y 轴
# plt.subplots(2, 2, sharex='all', sharey='all')
plt.subplots(2, 2, sharex=True, sharey=True)
不规则划分
import numpy as np
import matplotlib.pyplot as plt


def f(t):
    return np.exp(-t) * np.cos(2*np.pi*t)


t1 = np.arange(0.0, 3.0, 0.01)

ax2 = plt.subplot(221)
ax2.margins(2, 2)           # Values >0.0 zoom out
ax2.plot(t1, f(t1))
ax2.set_title('Zoomed out')

ax3 = plt.subplot(222)
ax3.margins(x=0, y=-0.25)   # Values in (-0.5, 0.0) zooms in to center
ax3.plot(t1, f(t1))
ax3.set_title('Zoomed in')

ax1 = plt.subplot(212)
ax1.margins(0.05)           # Default margin is 0.05, value 0 means fit
ax1.plot(t1, f(t1))

plt.show()
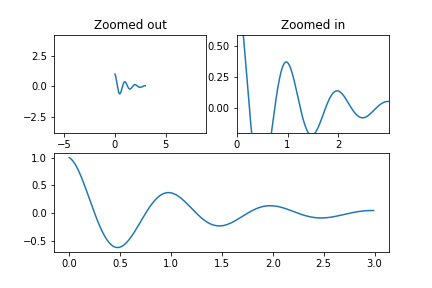
分成 2x2,占用第一个,即第一行第一列的子图
plt.subplot(221)分成 2x2,占用第二个,即第一行第二列的子图plt.subplot(222)分成 2x1,占用第二个,即第二行plt.subplot(212)
通过GridSpec来定制Subplot的坐标
GridSpec 指定子图所放置的几何网格。
SubplotSpec 在 GridSpec 中指定子图(subplot)的位置
subplot2grid 类似于 pyplot.subplot ,但是它从0开始索引
ax = plt.subplot2grid((2,2),(0, 0))
ax = plt.subplot(2,2,1)
以上两行的子图(subplot)命令是相同的。subplot2grid 使用的命令类似于HTML语言。
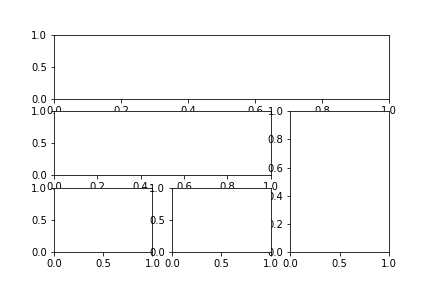
ax1 = plt.subplot2grid((3,3), (0,0), colspan=3)
ax2 = plt.subplot2grid((3,3), (1,0), colspan=2)
ax3 = plt.subplot2grid((3,3), (1, 2), rowspan=2)
ax4 = plt.subplot2grid((3,3), (2, 0))
ax5 = plt.subplot2grid((3,3), (2, 1))